

Breakdown written by Gabriel Kasmi, postdoctoral researcher at the school of Mines de Paris
The energy transition is largely based on the massive deployment of renewable energies, and in particular solar photovoltaic (PV) energy. A significant part of this growth is based on small rooftop installations, for which existing connection records - if they exist - are often incomplete. In a context of strong growth in rooftop PV, a precise, complete and reliable mapping of installations is necessary in order to improve the integration of these systems - whose weight in global electricity production is increasing - on the network.
Faced with this challenge, artificial intelligence (AI), coupled with aerial or satellite imagery, makes it possible to map rooftop PV installations on a large scale. Such data is valuable for evaluating, complementing, and correcting existing data. AI can thus greatly facilitate the estimation of the individual technical characteristics of PV systems (area, orientation, inclination, and installed power) at the country level based on aerial images and geospatial data. In other words, AI appears to be an essential lever for improving the observability of the PV fleet, thus being able to contribute to its integration into the electrical network in a context of strong growth.
However, one of the main obstacles to the adoption of AI models by actors in the PV sector lies in their lack of transparency. Despite their remarkable performances, neural networks are often criticized for being “black boxes”; because of the difficulty in interpreting their decision-making process. In practice, this opacity poses a limit: these models are sensitive to differences (change of location, type of shooting, etc.) between training data and real data (distribution shifts), which can cause a sudden and unpredictable collapse in their performance. However, such variations are frequent in real use cases, which calls into question the robustness and reliability of these tools in an operational context.
To meet this limitation, explainability approaches (XAI, Explainable Artificial Intelligence) provide tools to understand the decision-making process of “black box” models. This better understanding not only makes it possible to improve transparency with respect to the end user, but can also contribute to improving the reliability of these algorithms, thus promoting their applicability in application cases such as the remote sensing of rooftop PV systems.
In a recent search, an innovative explainability method, consisting in decomposing the prediction of the model in wavelet space, was proposed. Wavelets are a mathematical tool for representing an image at various levels of detail, which helps to better understand what information the model uses to detect a PV panel. As illustrated in the figure, this explainability method makes it possible to highlight the fact that existing models for detecting PV panels primarily associate patterns similar to grids with the presence of a panel in the image.
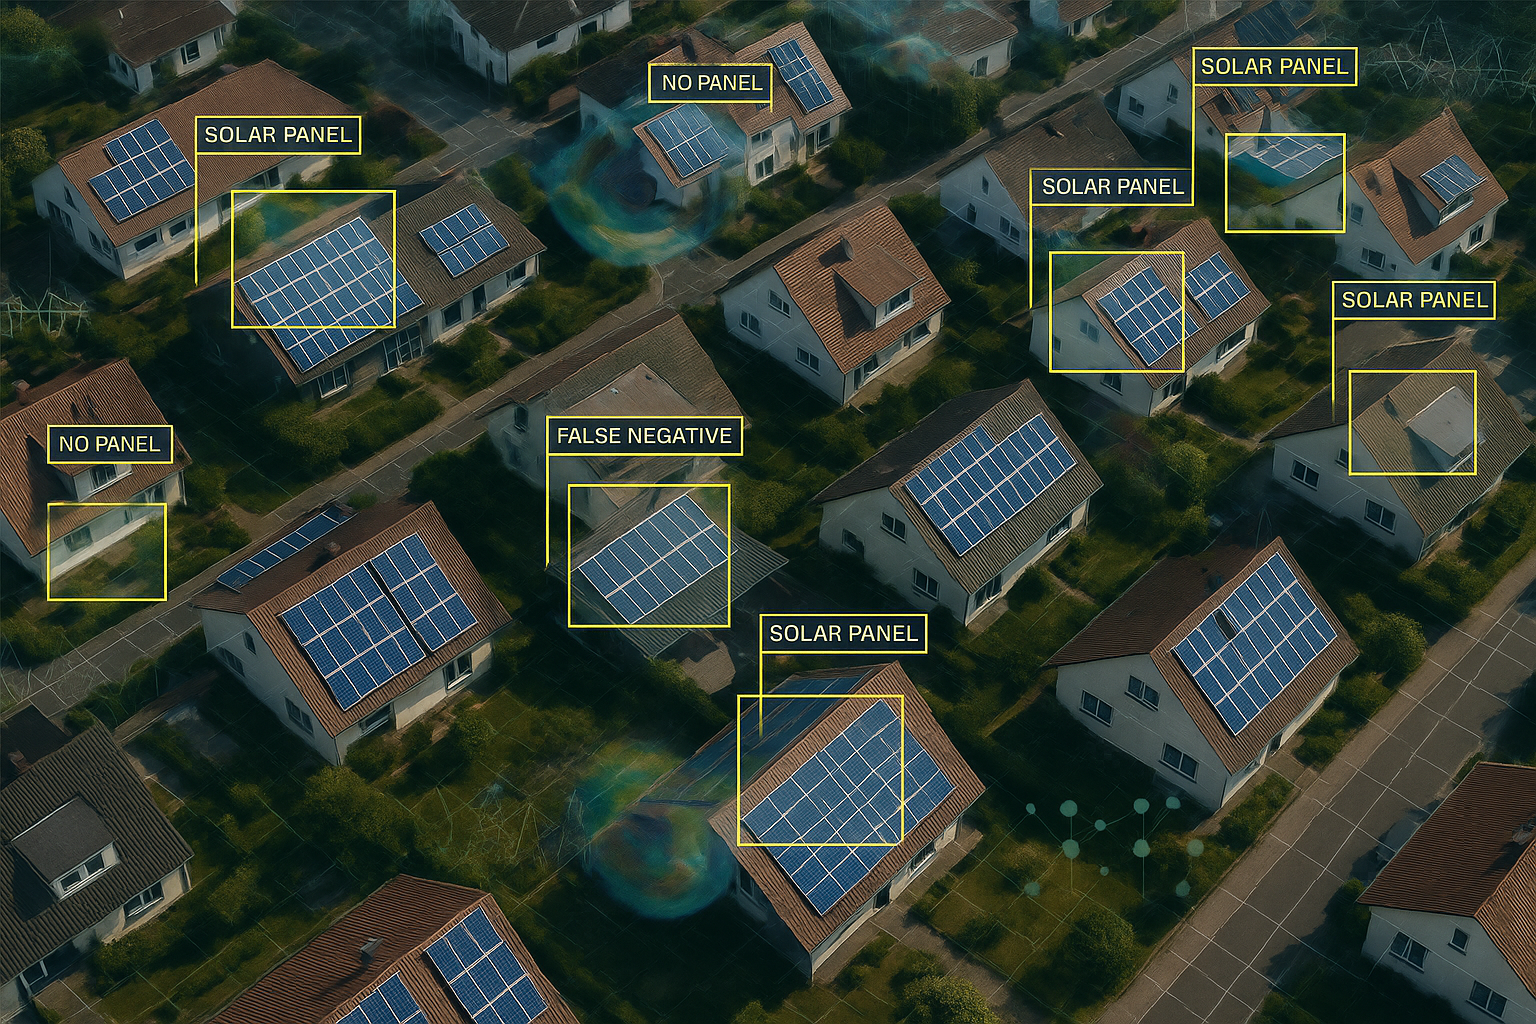
This observation has a triple impact. First of all, by explaining what the model “sees”, it is possible to explain its behavior, in particular the reasons for the occurrence of false positives and false negatives and thus understand why statistical variations affect the model: in the case of the detection of PV panels, it has been shown that the conditions for acquiring the aerial image, which can mitigate the importance of the grilled pattern on the image, lead to a drop in performance through an increase in fakes negatives. Then, as the decision-making process of the model is made more transparent, the end user is in a better position to appropriate it and therefore to anticipate its behavior and understand its limits. Finally, it makes it possible to question the quality and representativeness of the data used to train the model and identify potential biases in this data.
Thanks to explainability, AI models gain in transparency and reliability, facilitating their adoption by photovoltaic players. By clarifying how they work, it makes it possible to anticipate their behavior, identify possible biases and better integrate these tools into business processes.
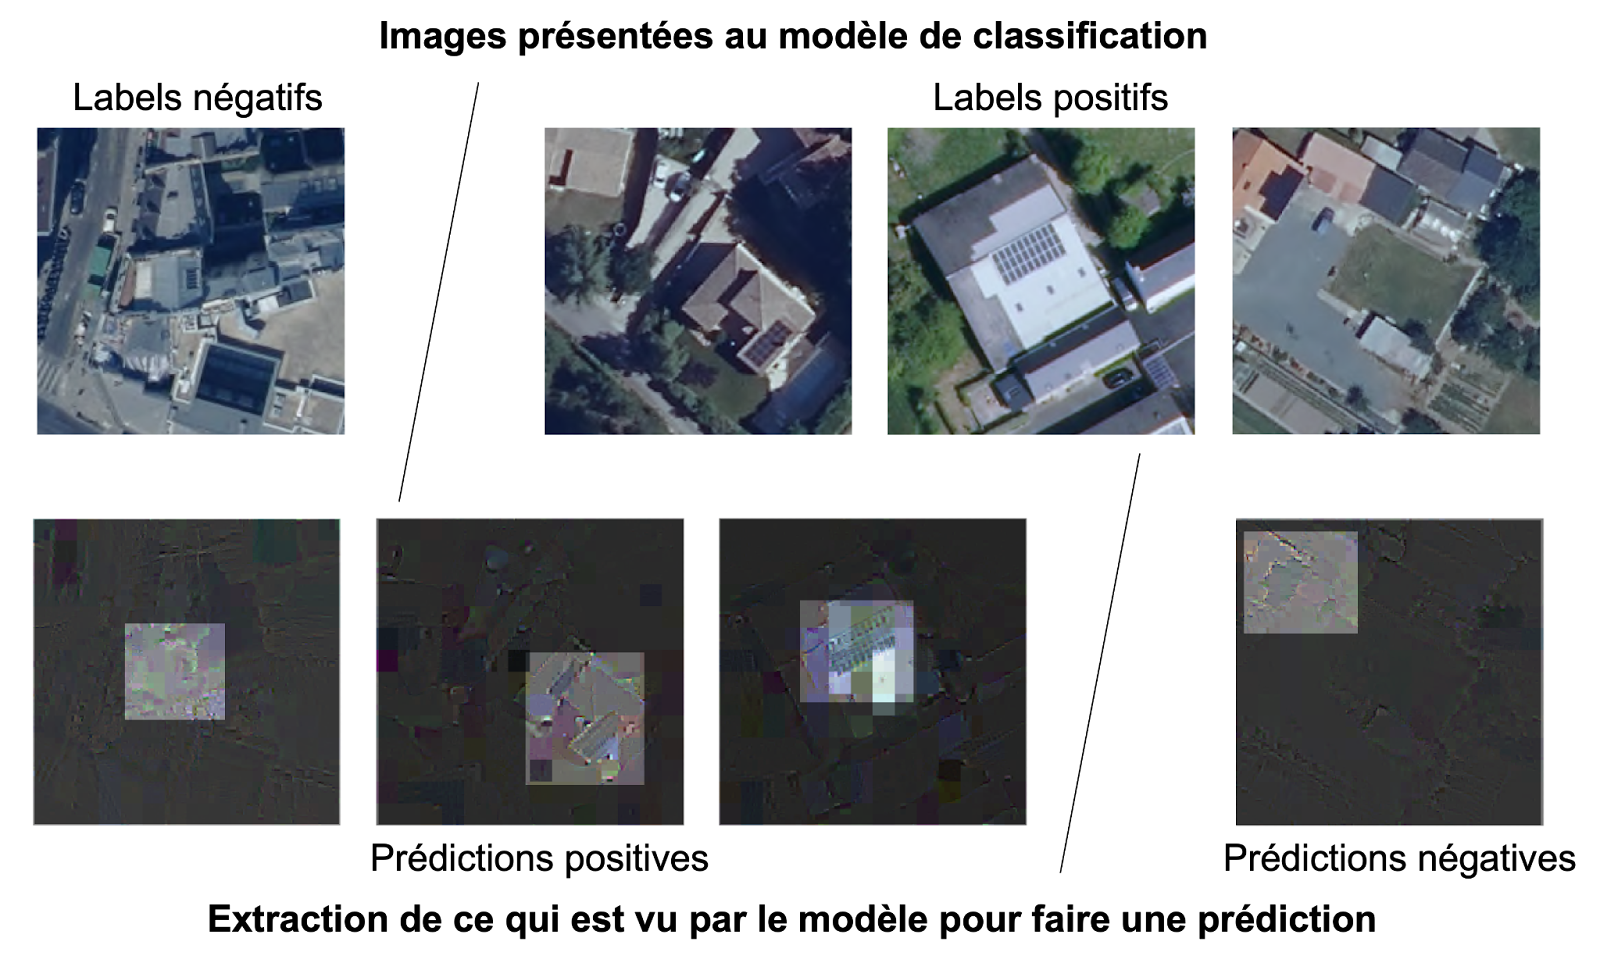
Figure: Examples of images classified by a detection model. Examples of images shown to the model are shown on the first line.
The labels correspond to the true class of the images. The second line represents the information extracted from this image by the model, according to the details described hither. The prediction corresponds to the label predicted by the model, which does not necessarily coincide with the true class. The minimal image extracted in this way shows that the grid pattern is predominant in making a classification. If the latter is absent (on the right), then the positive image is classified as negative (false negatives). On the contrary, if this pattern is noticeable in the image (left), then the model may tend to classify a negative image as positive (false positive).