


By the end of 2025, the Spanish equivalent of the CRE reported an electrical grid saturation rate of over 85% (with a mapping tool showing, for example, a rate exceeding 99% in the Spanish Basque Country). France is publishing its first map of constraints, with approximately 90% of its territory still capable of being connected.
Enedis and RTE have developed a map of "constrained zones" for connecting new production projects : out of nearly 2,300 grid cells analyzed, 239 appear saturated, representing 10.4% of the territory with no available capacity for at least five years. Enedis summarizes the intent : "We are in a phase of electrical regional planning. We need tools to help with planning." For twenty years, renewables were installed on a grid designed to serve consumption, and reinforcement followed. Now, grid capacity is becoming a location criterion that must be considered from the feasibility phase.
The map covers production projects connected to the medium and low-voltage Enedis network. The 5% of the territory served by local distribution companies is shown in white, saturated zones in red, and areas where no saturation is identified in gray, though without a capacity guarantee: verification is then carried out via Caparéseau, the RTE tool linked to the S3REnR. The data will be updated three times a year. The red zone does not prohibit anything: it makes public a delay that was previously only discovered during the application review process.
A Zenon analysis (May 2026) established this diagnosis for industrial connections: a grid that is rarely physically saturated, but often contractually saturated, with "zombie projects" clogging the queue. The map applies this finding to the production side of the distribution network. The first half of 2026 report RTE confirms it: the Île-de-France region is subject to a very high number of grid access requests, some of which are speculative. A redesign of the connection framework is justified by the need to prevent "ghost" projects from reserving capacity at the expense of mature ones.
The geography of the red zones overlaps with that of the countryside areas where photovoltaics have been deployed the fastest (essentially the "empty diagonal"). These territories had a grid sized to serve sparse consumption, not to evacuate increasing production. The bottleneck is concentrated at the interfaces between transmission and distribution: Enedis operates approximately 2,300 of them and plans to build about a hundred more by 2030. As early as 2023, the IEA pointed out that grid infrastructure takes five to fifteen years to complete, while a renewable project is deployed in one to five years.
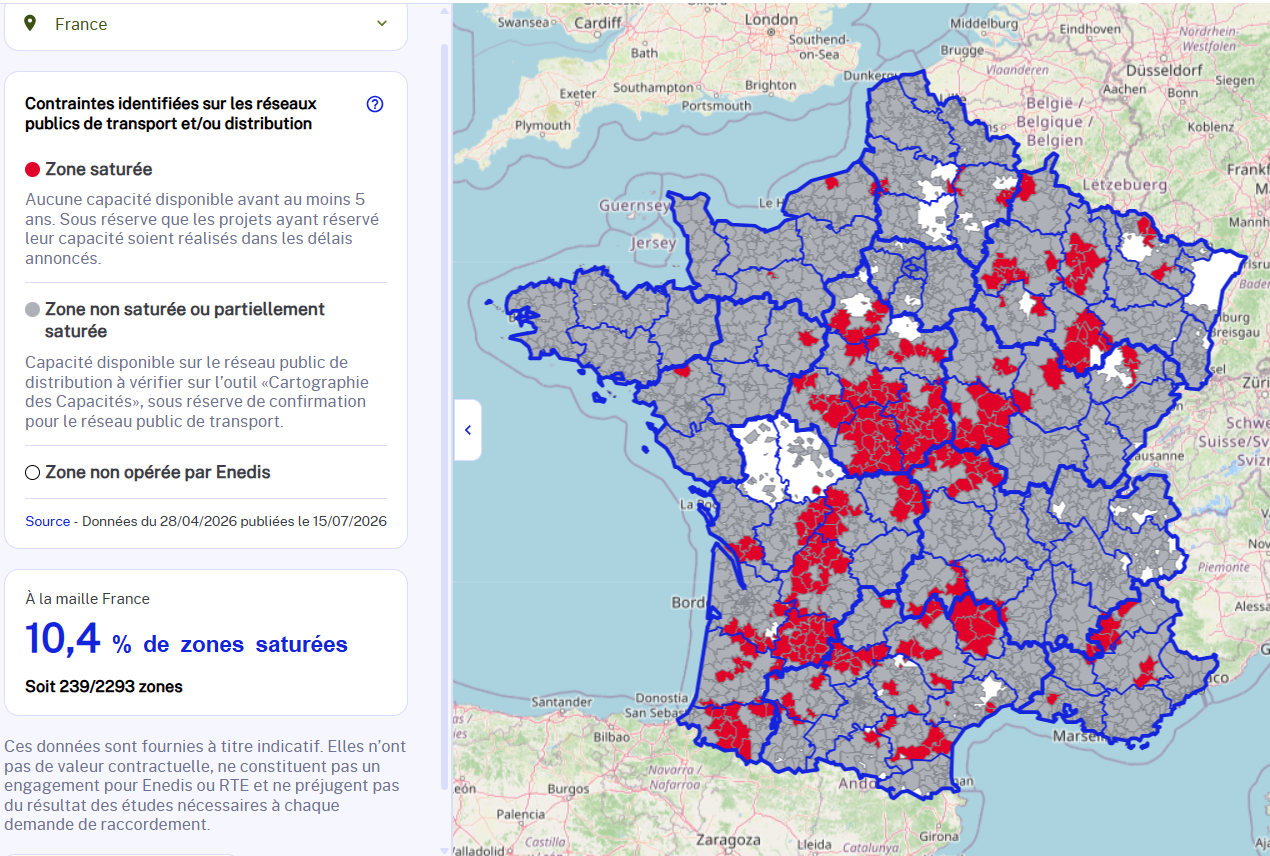
Source: Enedis Observatory
In the caption, in addition to the source, add: A word of caution regarding the unit of measurement is necessary. The 239 saturated grid cells account for 10.4% of the covered territory, not 10.4% of the connectable potential. The missing data exists: the renewable energy mapping portal, developed by the IGN and Cerema for the implementation of the APER law, publishes potentials by sector and counts RTE and Enedis among its data providers. The resources of both tools are open and downloadable. No cross-referencing has been published. Until it is, the map indicates where connection is constrained without stating what share of potential deployment is affected.
Two development philosophies are clashing: a grid that strengthens where projects emerge versus a grid as a prescriptive structure that directs projects to where capacity exists. A third stance is emerging in the RTE report: neither following projects nor rationing based on legacy, but designating in advance where production capacity (9 GW additional by 2029 in industrial-port zones and 5 GW in five other priority zones) can be consumed
The map makes the risk of non-connection transparent without reducing it. Rationing already existed, opaque and hidden in queues; it is now public and verifiable before any land or financial commitment. The fundamental question remains: while awaiting the revision of the S3REnR, the geography of the transition is provisionally dictated by legacy infrastructure. RTE must complete the overhaul of its connection framework by the end of 2026, based on the principles of over-reservation and "first come, first served," with an experiment in Île-de-France starting in the second half of the year, where full-power access will be granted in exchange for a financial commitment and a contractual ramp-up schedule. The real arbitration will therefore take place within these revised schemes: that is where it will be decided whether the 2026 map will remain a transitional snapshot or become the lasting plan for France's electrical geography.